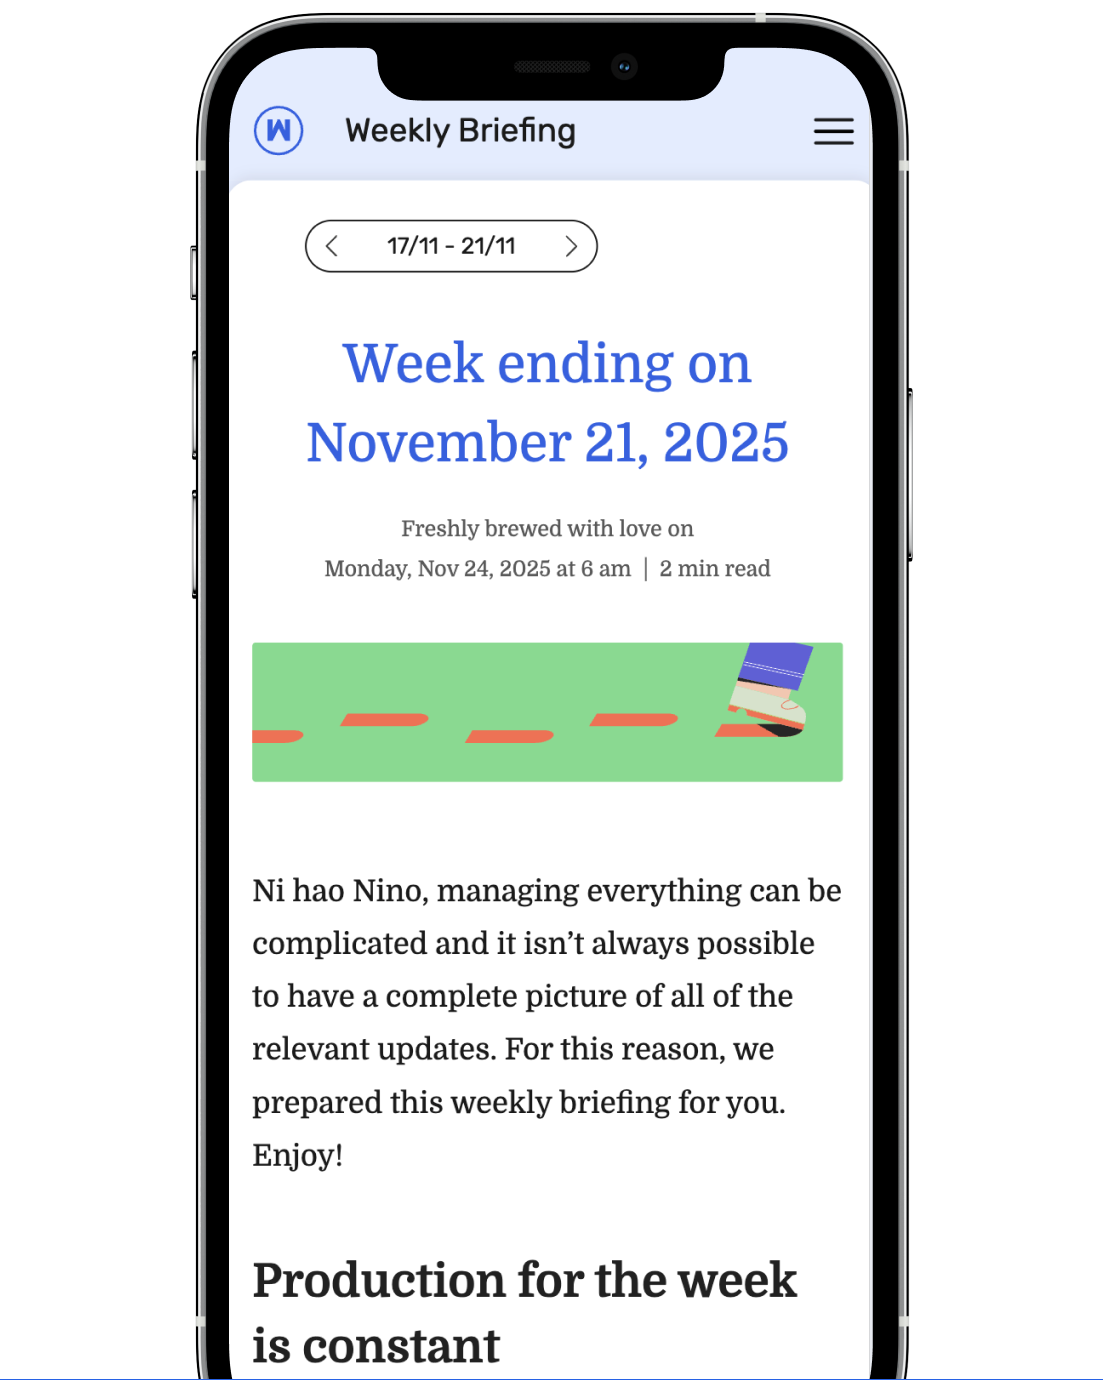
Mondays are hard enough as it is — don’t make them worse by hunting for scattered data. wethod serves you breakfast with an automated narrative briefing that tells you exactly what happened last week. Sales, hours worked, top-performing projects: it’s all there, in black and white.
Spot critical projects at a glance (before they spiral)
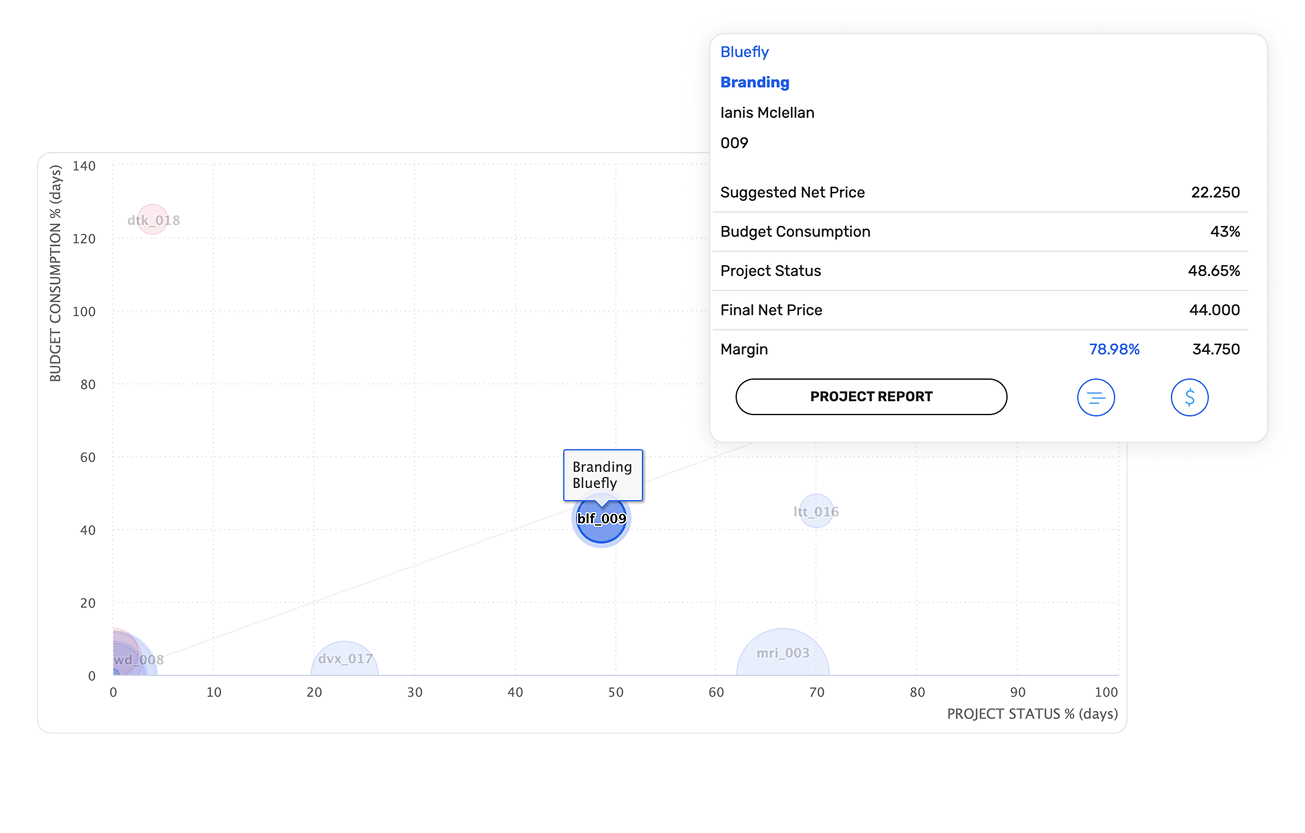
Excel spreadsheets are great at hiding problems between the lines. wethod does the opposite: it highlights them on intuitive bubble matrices. The size indicates the project’s value; the position shows its health.
Consumption vs Status
Is the project actually moving forward, or are we just burning through hours? Instantly spot projects in distress and intervene with surgical precision — before it’s too late.
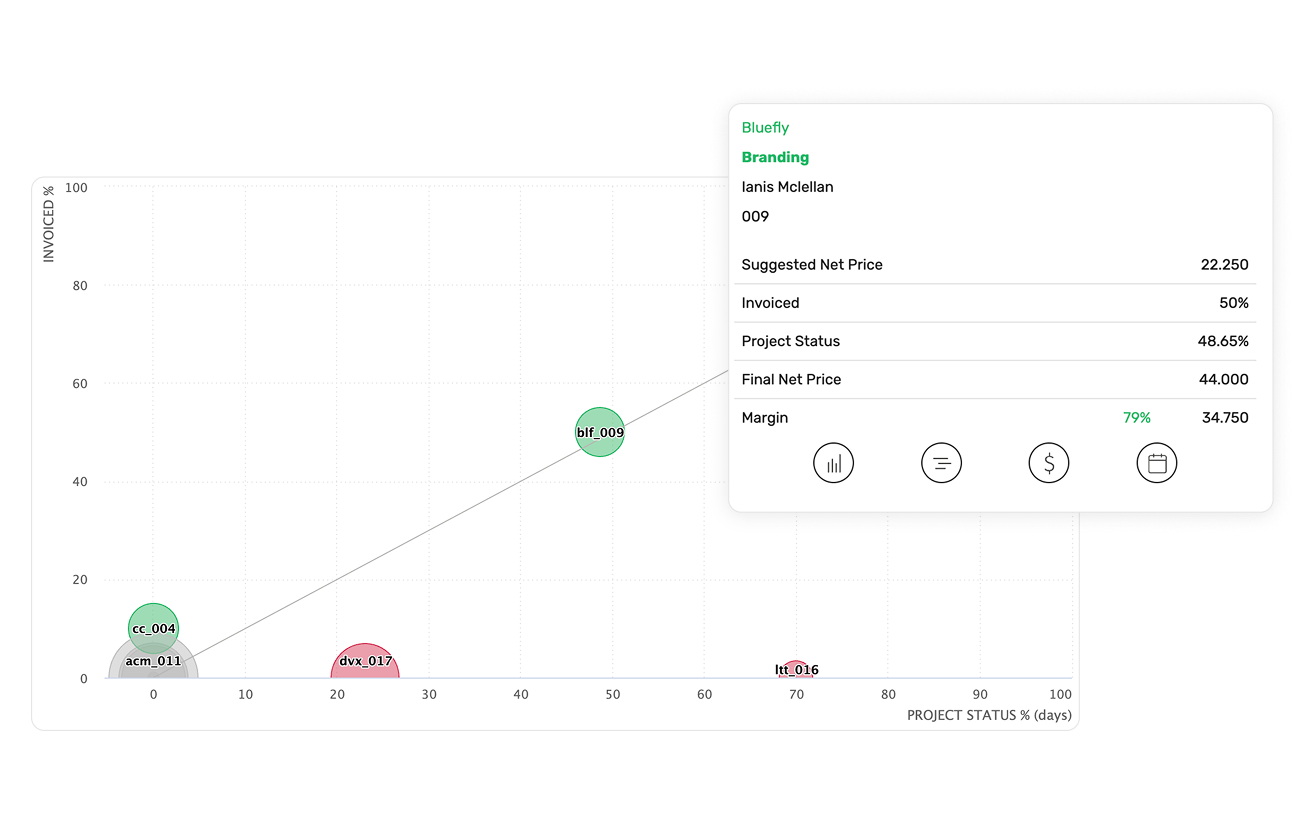
Invoiced vs Status
Are production and billing moving at the same pace? Verify if your invoicing is in sync with the work performed or if you’re accumulating a dangerous billing backlog.
Revenues and Gross Margin: the truth is in the details
Looking at total revenue is reassuring, but often misleading. Through the accrual-based view, you can visualize the real distribution of revenue and the timing of your production. Go even deeper with the Gross Margin to distinguish projects that generate real profit from those that are silently eroding your margins.
Big picture or granular detail? It's up to you
Start from the general trend and then drill down. Create custom charts by filtering data across any relevant dimension: Client, PM, Business Unit, Project Type, and more. Finally, you can distinguish projects that drive profit from those that only bring more work (and headaches)
Sales Performance: the engine of your growth
Selling "a lot" isn't enough; you need to sell well. Keep a close eye on your pipeline health by monitoring more than just volume. Focus on quality: average project value, conversion rates, and the projected profitability of your proposals.
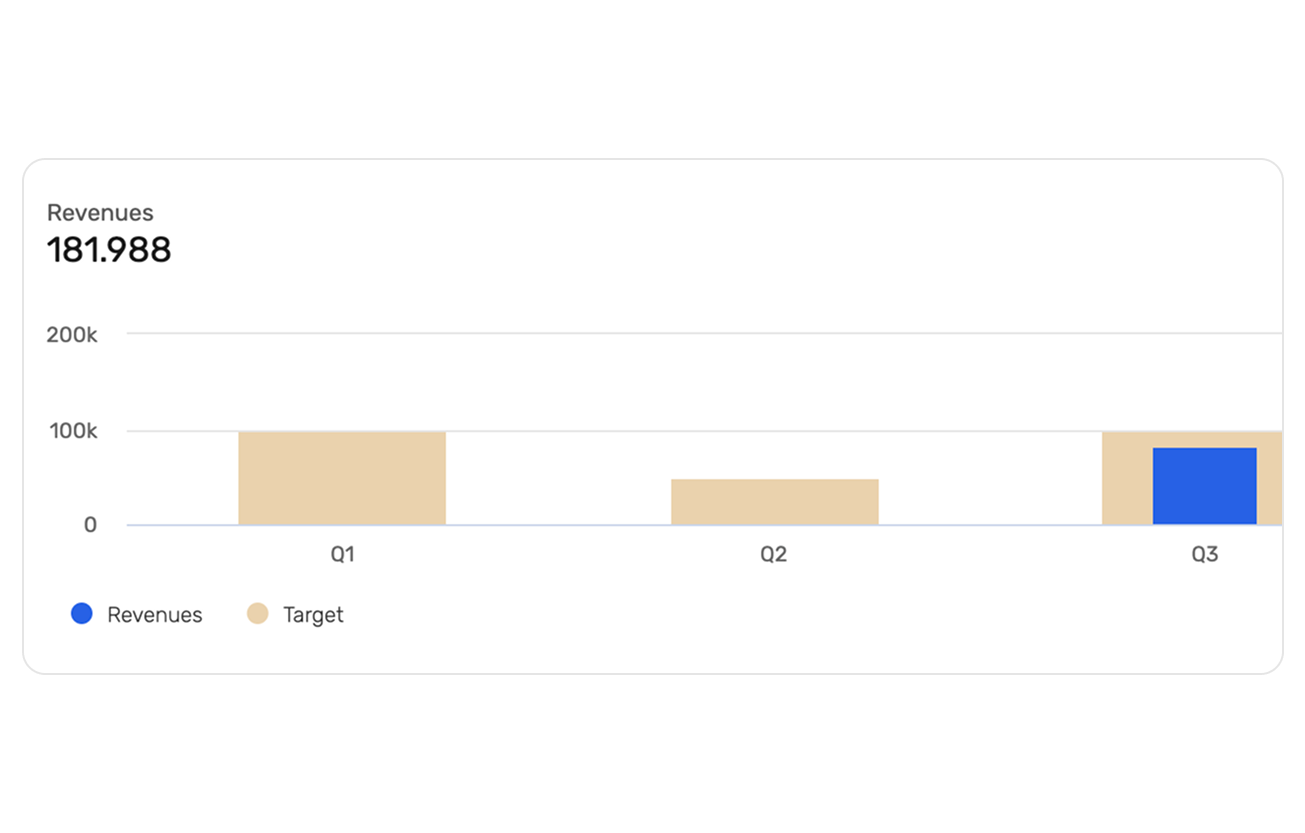
Annual target
Set your revenue goals and monitor your progress day by day. wethod tells you if you’re on track, falling behind, or if it’s time to pop the champagne.
Client Intelligence: your customers, unfilters
In business, the past is history; what matters is what happens next. wethod's Revenue Clock gives you the superpower of foresight: visualize future revenue for every client, quarter by quarter.
Beyond revenue
Sometimes your biggest clients aren't your most profitable. wethod highlights the data that actually matters: conversion rates, profitability, and average project value. Because filling your portfolio with big names is great, but filling it with profitable clients is better.
Give your data the power to decide
Your intuition knows the way, but numbers confirm the direction. Move from gut-feeling management to a data-driven strategy. wethod is the bridge that transforms your daily operations into pure strategy.
Thank you! We will contact you as soon as possible
Oops! Something went wrong.
Do you still have doubts?
We're not the oracle, but maybe we still have some answers for you below.
wethod's Insight system aggregates data from sales, production, and project management into ready-to-use strategic reports, updated in real time. It allows you to visualize revenue, margins, project performance, and your sales pipeline without having to combine Excel files or separate tools.
Yes, wethod allows you to filter and analyze data by project, client, PM, business unit, or project type. It shows real-world revenue, gross margins, and average project values, helping you distinguish profitable clients and projects from those eroding your margins.
With wethod, you can monitor your pipeline, average bid value, conversion rates, and progress toward your annual target. You’ll receive alerts on potential delays and insights to quickly decide where to intervene to drive growth.
Oh, yes! Thanks to the Revenue Clock, wethod shows projected revenue for every client, quarter by quarter. This allows you to plan sales strategies and understand which clients generate the most profit relative to total turnover.
Through a dedicated bubble chart, wethod immediately shows you if a project is consuming hours without moving forward. By comparing Budget Consumption (% of hours logged) vs. Project Status (% of progress), you can identify which projects require corrective action before it’s too late.
wethod costs €22 per user/month + VAT and includes all the platform's features.
The price also includes: → initial configuration and setup with our team’s support → personalized training sessions via video call, tailored to your teams → data import (we provide Excel templates, and our dev team handles the upload) → ongoing support via a dedicated Slack channel for the duration of your subscription
Find out more about our subscription plans at this link.
Yes! You can request a free, personalized demo to discover how wethod can help you bring meaning to your company's work, simplify processes, and improve control over projects and margins. During the demo, you’ll see every feature in action and can discuss any questions or curiosities with one of our experts. After the call, you’ll also be able to access a free trial of the platform.


'%3e%3cg id='Final-Copy-2_2_' transform='translate(1275.000000, 200.000000)'%3e%3cpath class='st0' d='M7.4,12.8h6.8l3.1-11.6H7.4C4.2,1.2,1.6,3.8,1.6,7S4.2,12.8,7.4,12.8z'/%3e%3c/g%3e%3c/g%3e%3c/g%3e%3cg id='final---dec.11-2020'%3e%3cg id='_x30_208-our-toggle' transform='translate(-1275.000000, -200.000000)'%3e%3cg id='Final-Copy-2' transform='translate(1275.000000, 200.000000)'%3e%3cpath class='st1' d='M22.6,0H7.4c-3.9,0-7,3.1-7,7s3.1,7,7,7h15.2c3.9,0,7-3.1,7-7S26.4,0,22.6,0z M1.6,7c0-3.2,2.6-5.8,5.8-5.8 h9.9l-3.1,11.6H7.4C4.2,12.8,1.6,10.2,1.6,7z'/%3e%3cpath id='x' class='st2' d='M24.6,4c0.2,0.2,0.2,0.6,0,0.8l0,0L22.5,7l2.2,2.2c0.2,0.2,0.2,0.6,0,0.8c-0.2,0.2-0.6,0.2-0.8,0 l0,0l-2.2-2.2L19.5,10c-0.2,0.2-0.6,0.2-0.8,0c-0.2-0.2-0.2-0.6,0-0.8l0,0L20.8,7l-2.2-2.2c-0.2-0.2-0.2-0.6,0-0.8 c0.2-0.2,0.6-0.2,0.8,0l0,0l2.2,2.2L23.8,4C24,3.8,24.4,3.8,24.6,4z'/%3e%3cpath id='y' class='st3' d='M12.7,4.1c0.2,0.2,0.3,0.6,0.1,0.8l0,0L8.6,9.8C8.5,9.9,8.4,10,8.3,10c-0.2,0.1-0.5,0.1-0.7-0.1l0,0 L5.4,7.7c-0.2-0.2-0.2-0.6,0-0.8c0.2-0.2,0.6-0.2,0.8,0l0,0L8,8.6l3.8-4.5C12,3.9,12.4,3.9,12.7,4.1z'/%3e%3c/g%3e%3c/g%3e%3c/g%3e%3c/g%3e%3c/svg%3e)